


REPORTS module allows users to track various activities relating to sales, finance, marketing, inventory management, patient flows, and office operations. Different reports provide an overview of a clinic’s sales, conversions, and overall performance.
PREREQUISITES: 'view reports' and 'edit reports' permissions are required to work with Manage reports.
Run default reportsThe list of default reports appears under respective categories on the left.
Default reports and report categories cannot be edited or deleted; they can only be copied. Copied reports and categories can be customized by user.
To run an existing report:
1. Open the report category using 2. Left click a chosen report3. Verify the preview parameters on the right4. Click SUBMIT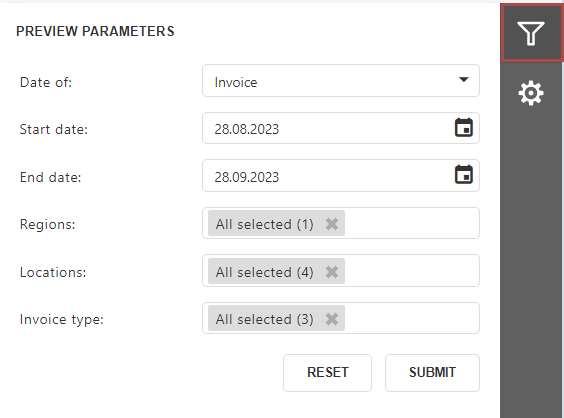
Parameters Filter your data by report date, regions, hubs, spokes, specialist, product type, invoice type etc. Depending on the report type, you will have a different set of filters.
NOTE: The date range is always based on the chosen report date. This means the report will process periods (week/month/quarter/year) that include the selected date. Example: Report date = 22.12.2022 and Period = month. This means the report will show data for December 2022.Export Options Configure export settings (export mode, layout and appearance, etc.)
Creating custom report categories
In order to keep your reports organized, you can create additional report categories. To create a new category:
- Use
next to the REPORTS heading
- Click ADD DIRECTORY
Alternatively, you can COPY an existing category using  next to the category's name and customize it later.
View and print reports
Viewing and printing controls are available for all reports. Each report is paginated which allows users to check and print each page separately or work with the whole report at once.
|
|
First Page | Return to the first page |
|
|
Previous Page | Return to the previous page |
|
|
Page Count | Check which report page is shown |
|
|
Next Page | Go to the next page |
|
|
Last Page | Go to the last page |
|
|
Toggle Multipage Mode | Switch between single-page and multiple-page views |
|
|
Page Size Controls | Adjust the page size with Zoom in (+) or Zoom out (–). Alternatively, click on Page Width to adjust the size. |
|
|
Send to printer | |
|
|
Print Page | Print the current page |
|
|
Export To | Export to a selected format: PDF, XLS, XLSX, RTF, DOCX, MHT, HTML, TEXT, CSV, IMAGE (PNG). |
|
|
Search | Search in the current report |
|
|
Full Screen | Switch to the full screen mode |
More about specific reports in our E-learning course
You can use standard (read-only) reports as templates for customization.
To create a customizable copy:
- Select an existing standard report.
- Open a three-dot menu, select COPY REPORT, then CONFIRM.
- A newly created custom report appears at the top of the list.
- (Optional) Rename the report for easier identification by opening a three-dot menu and selecting RENAME REPORT.
- Open the three-dot menu again select EDIT REPORT.
- Customize the copied version as needed.
- Use the custom report for analysis or export.
Custom reports can be renamed, copied again, organized into folders, or deleted.
Editor Structure and Navigation
- Report Bands (Layout Structure)
A report layout consists of bands. Bands define where controls appear and how often they are printed on the document.
You can view, select, and manage bands using the colored panel on the left side of the report canvas.
A report layout consists of bands that contain report controls and define their location on document pages.
Commonly used bands include:
- Top Margin / Bottom Margin
Printed once on every page. Typically used for page numbers or static footer text. - Report Header
Printed once per document. Used for unique item information such as document number, date, patient details, or clinic information. - Group Headers
Used when data is grouped (for example, grouping line items by category). - Detail Band
Displays repeating data from the dataset. This band is printed once for each record (for example, each product or service).
- Place descriptive information in header bands.
- Place repeating row-level data in detail bands only.
- Report Designer Interface Overview
When editing a report template, the Report Designer interface consists of the following main areas:
(1) Left panel – Toolbox
The Toolbox contains controls that can be added to the report layout:
- Label
Displays static or calculated text. - Picture Box
Used for logos or branding elements. - Table
Displays structured, tabular data.
To add a control, drag it from a Toolbox and drop it onto the report canvas.
(2) Upper panel - Document Viewer Toolbar
Provides standard actions such as:
- Cut, copy, paste
- Undo / redo
- Zoom and scaling options
(3) Right panel – Configuration Tabs
The right panel contains four tabs used to configure the report:
- Properties
Displays settings for the selected element, such as title, formatting, alignment, borders, and size. - Expressions
Used to define calculated or formatted values based on existing fields. When editing an expression, the Expression Editor opens. - Fields
Displays all dataset fields available for use in the report.
Parameters control which data is included in the report (for example, date range, location, product type etc.)
Users can: - Search for fields and drag them onto the canvas.
- Create calculated fields based on existing fields.
- Update description or sorting order in Parameters.
Do not modify or delete existing dataset fields or parameter bindings.
Incorrect field or parameter changes may prevent the report from loading or returning data.
- Report Explorer
Shows a hierarchical view of all bands and elements, helping with navigation and selection.
(4) Center – Report Canvas
The Report Canvas is the central area where the layout is visually designed.
You can position, resize, and align elements directly on the canvas.
(5) Preview mode
Preview mode shows how the report will look with real data before saving or using the report.
It is recommended to preview changes after each significant modification.
Understanding Report Data (Datasets)
Reports use predefined datasets, typically based on backend queries or stored procedures. If certain information is missing in the report, it means the data is not provided by predefined queries.
Key points to understand:
- Only fields included in the dataset are supported.
- Dataset structure must not be modified.
- New datasets or fields (unless based on an existing field) cannot be created within report. Only calculated fields derived from existing data fields can be used.
- If required information is not available, the customer is advised to submit a request to extend dataset.
Step-by-Step: Common Customization Tasks
For large datasets, simplify the band structure to improve readability and performance.
For Excel exports, we recommend removing decorative headers or footers to enable seamless filtering and sorting.
Most common customization tasks for reports follow the same steps as in printout templates, including:
More information about the underlying Web Report Designer framework is available in the developer documentation: Report Designer | DevExpress End-User Documentation.